

Ultimate Trading Risk Management Guide: Set Up Your Stoploss
Table of Contents: Stoploss
The Importance of Setting a Stoploss
Setting a stoploss is one of the most crucial steps to adhering to your risk management system. Trading without a stop loss is an inevitable way to ruin your trading career before it even kick-off.
Hence, employing a stoploss strategies is an integral part of trading. It signifies a point where you will decide to cut your losses short before your losing positions wipe out your entire account. Unfortunately, many traders (especially beginners and intermediate) cannot bear the pain of taking even a slight loss, so either:
- They don’t set a stoploss point to begin with, or
- They don’t stick to the stoploss point they set.
Instead, they stay in denial of the “paper losses” they incur until they can no longer bear it and sell at any price to get out of the emotional torment caused by the losing trade.
Cutting losses at your designated stop-loss limit price is not a failure in trading. In fact, it is one of the natural outcomes.
No matter how great your analysis is, you can never be correct every single time. So, when you are wrong, you must ensure you’re out of that losing position as soon as possible. Think of it this way: in the grand scheme of things, stoploss saves you money, and more importantly, it stops the bleeding before it becomes unbearably worse.
Furthermore, hope is never a strategy. Inexperienced or undisciplined traders will disregard their stop loss because they are “hoping” that the price will eventually recover. It is a bad habit in trading that leads to a catastrophic outcome sooner or later in your trading career. You probably already heard the famous passage that many successful traders echo: “Cut your losses short and let your profits run.” Simply put, this passage could be translated to: “Adhere to your stop-loss insurance when the price goes against your bias so you can let your winning trades offset it.”
The importance of cutting your losses short can be best illustrated by the graph below:

As you can see, the more you hold on to a losing position, the harder it is to offset by your other profitable trades.
Rules for Placing a Stoploss
Determine your stoploss before entering a trade
Never enter a trade without setting your stop loss point! Your stop loss in trading must always be prioritized above all. Moreover, always put it before your target price and when the market is volatile, set it even before your entry point.
Use the same time frame for setting your entry and stoploss
This allows your stop-loss order point to be as objective and relevant as possible. For example, when day trading, it is NOT ideal to use a longer time-frame chart to look for setups, patterns, or support/resistance to be the basis for your stoploss since the intraday price movement (ex. 1, 5, 10 mins) will be choppier/reactive and more likely to fall victim from wide swings compare to longer-term time-frames (ex. one day, one week, one month).
Place your stoploss at a point that breaks the support, pattern, or invalidates the setup when hit
This is the most objective way to set up a stoploss point. Ideally, hitting your stoploss must mean either of these:
- the setup you are seeing is invalidated;
- the supposedly support level (resistance level if you are shorting) is broken;
- the price pattern (ex: head and shoulders, cup and handle, etc.) failed to materialize.
- The closer your stoploss at your entry, the better
This is because the farther your cut loss is to your entry, the more risk percentage you are taking. Therefore, if your stoploss is placed correctly (adhering to #3), it should be the nearest possible point after breaking the setup, pattern, or support.
Always respect your stoploss
Most importantly, once you set your stoploss, adhere to it religiously. Hence, when you determine your stoploss point and, unfortunately, the trade goes against you and hits your cut loss, always sell – no ifs and buts.
Not respecting your stop loss by either letting your emotion get the better of you by not selling when it is hit or adjusting it further down when the price goes near it is, in fact, tantamount to gambling. You are essentially taking more risk and diminishing your position’s risk/reward ratio.
Setting Up Your StopLoss
Price Structure
Breakouts
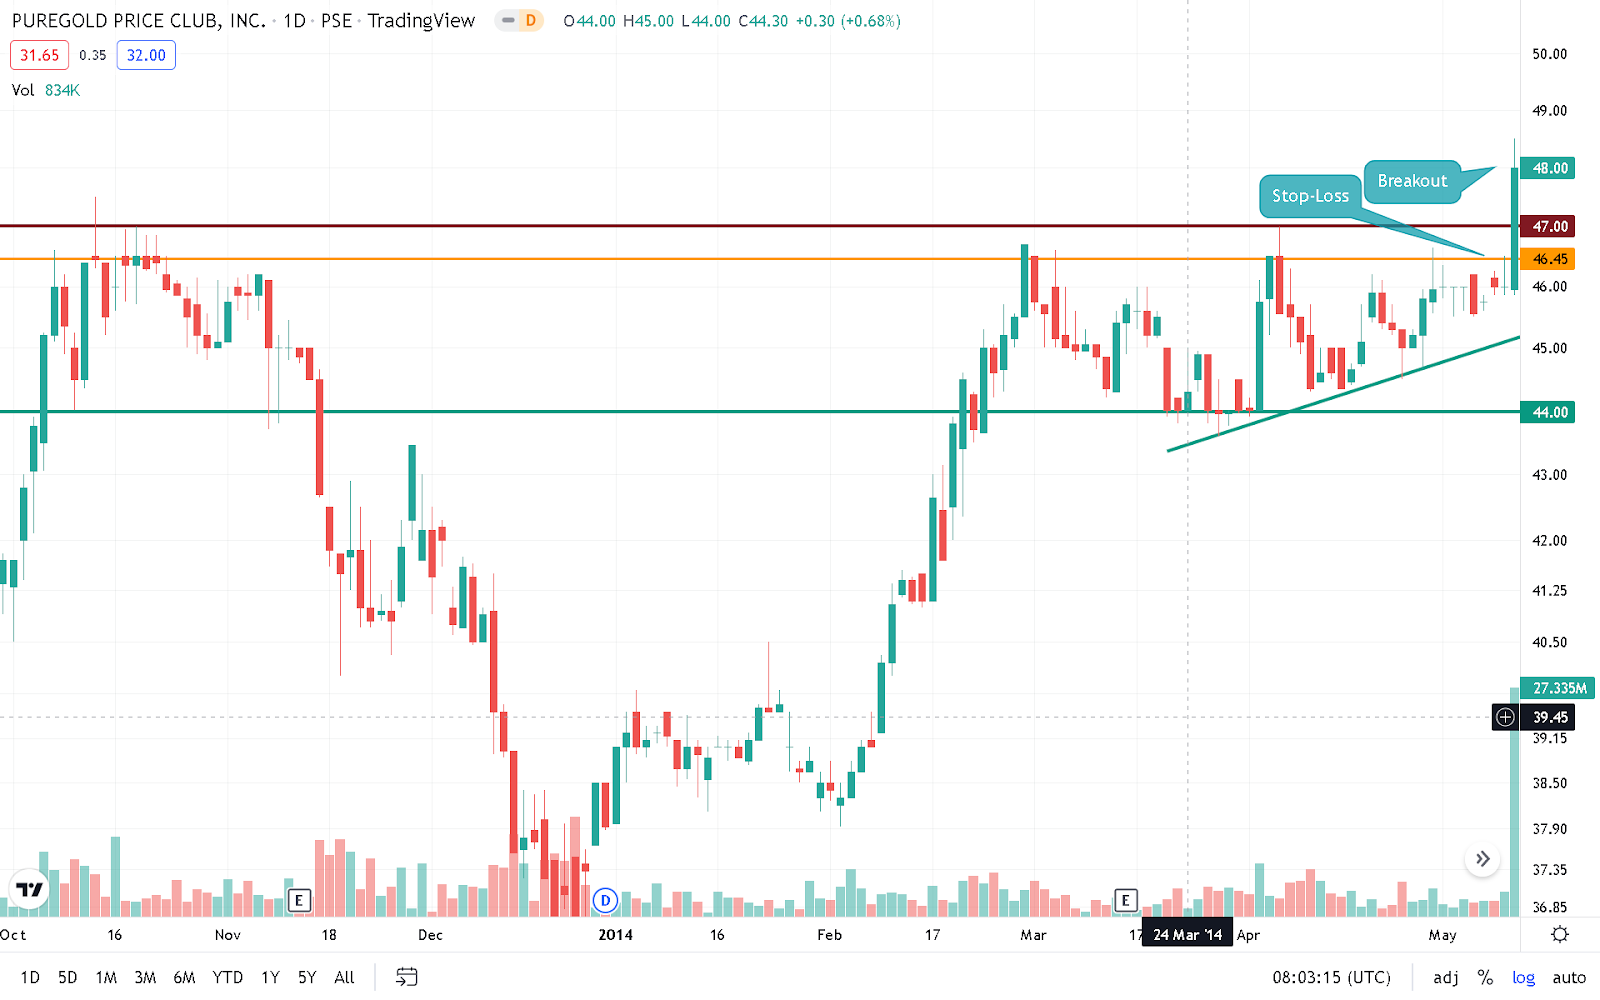
Always put your stop-loss a few ticks below the previous resistance level when trading breakouts. In the above illustration, the previous resistance was also the upper base of the previous consolidation between 44-47. Therefore, if the stop-loss point is hit, that would most likely mean that the setup was invalidated and the breakout was unsuccessful (fakeout!).
Pullbacks

When trading pullbacks, set your stop-loss a few ticks below the previous resistance (which has become support). A pullback means a rest in price action momentum and a chance to enter an existing trend. If the stop-loss has been hit, then most likely, the supposed pullback pattern is invalidated, and expect a further downturn from this point on.
Ranges

Always put your stop-loss below the range’s support level when trading ranges. When the price is nearing the support of a range, it should bounce back as heavy demand is apparent in the area. However, the range pattern is invalidated if your stop-loss has been hit. Hence, the supposedly support level will be a resistance level soon, and the price action bias will be against yours.
Trendlines
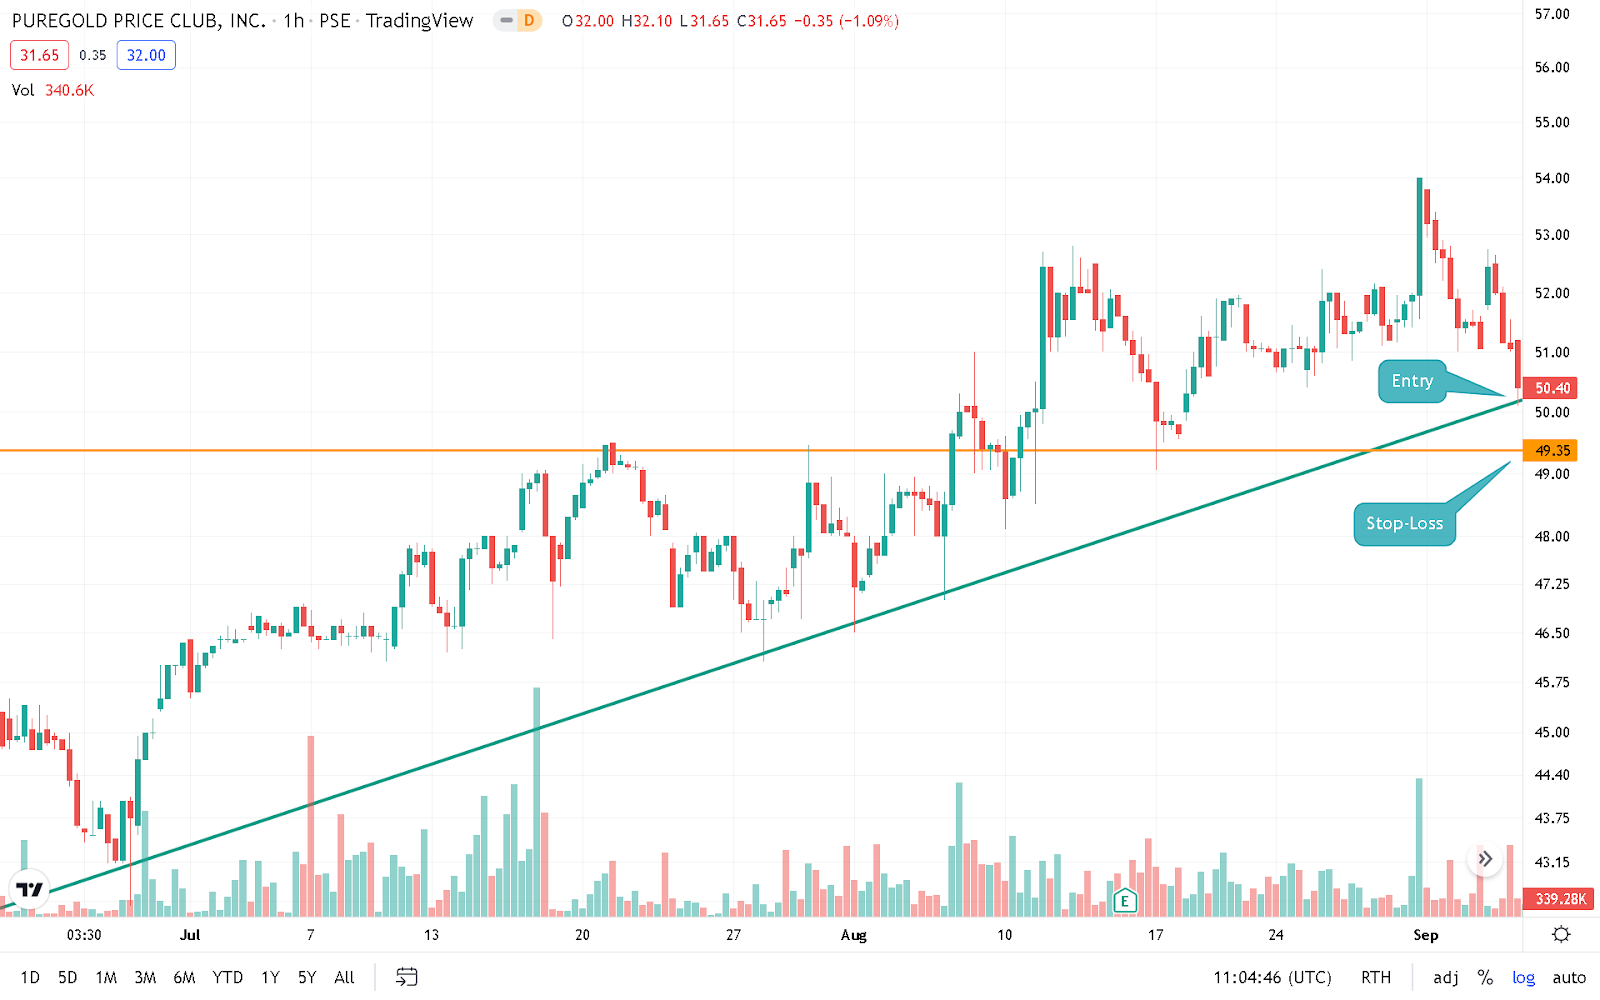
Always put your stop-loss level a few ticks below the trendline when trading using trendlines. If an established trend, in this case, is an uptrend, it must continue trending upwards and must not break the trendline during its correction course. Otherwise, if the stop-loss has been hit, that most likely means a shift in trend. As a result, it will either consolidate for much longer or worse; it will trend against your bias. In this illustration, that would mean a looming downtrend.
Volatility and Oscillators Indicators
Moving Averages (MAs)

Setting a stop-loss point using a moving average is almost similar to a trendline. Set it below your particular moving average (in this case, it is a 50-day MA). A moving average tracks the momentum of the price. Thus, never use MAs on non-trending (low momentum) price movements. Moreover, if the price is consolidating or trading within a range, the use of MAs will be unreliable and ineffective.
Moving Average Convergence Divergence (MACD)

The MACD shows the relationship between two moving stock price averages. As an oscillator indicator, it is best used as a “divergence” tool. Divergence means that two sets of values contrast each other. In this illustration, the indicator, MACD, and the price movement head in opposite directions.
In this case, the “lagging” indicator, MACD, becomes a “leading” indicator by providing a cue of a possible trend reversal. When the trendline in MACD breaks, it could mean that the price action will follow, just in opposite directions.
Set your entry price when the MACD trend breaks and your stop-loss is just a few ticks above the trendline break.
Relative Strength Index (RSI)

RSI measures the magnitude of recent price changes to mainly analyze “overbought” and “oversold” areas. Similar to MACD, it is best used as a divergence tool to identify a shift in price momentum. As shown, the price continuously trends higher (uptrend) while the RSI trends in the opposite direction. Thus, you can set your entry price when the RSI trend breaks and your stop-loss just a few ticks above the trendline break.
Stochastics (STS)

STS compares a particular closing price of a stock to a range of its previous prices over a certain period of time. Together with MACD and RSI, it is best used to identify divergence in price momentum and predict a potential end of a trendline. Consider setting your entry when the STS trend breaks and your stop-loss just a few ticks above the trendline break.
Fibonacci Retracements (Fib)
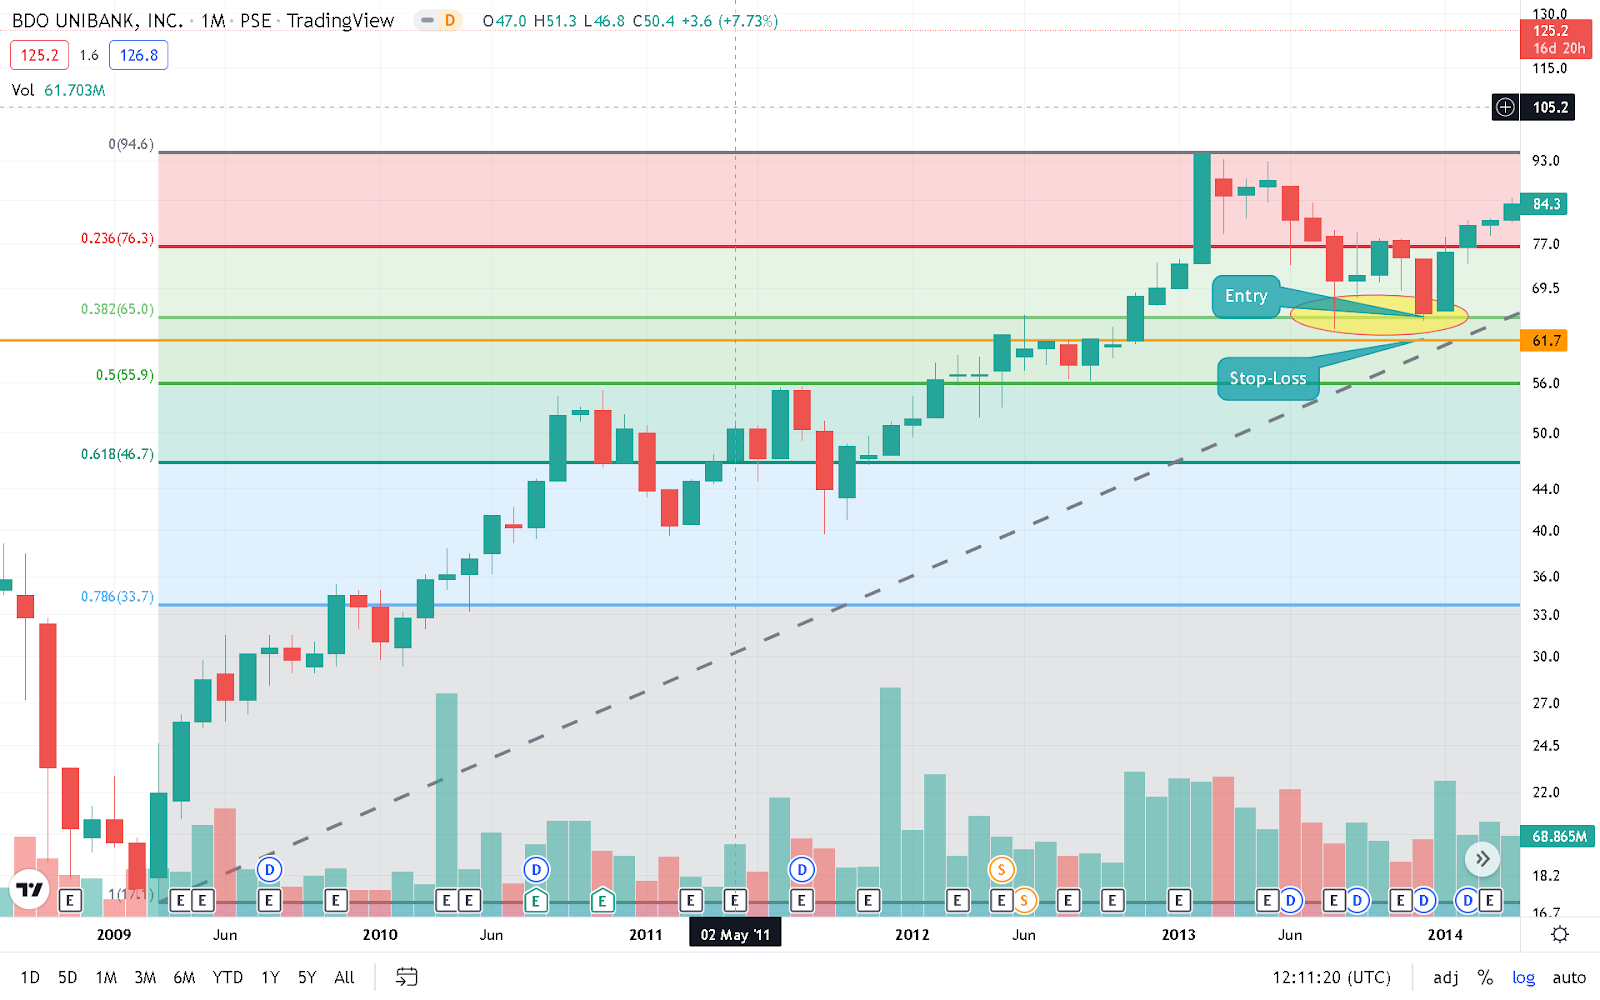
Fibonacci Retracement is based on the principle that after a price moves in one direction, it will soon “retrace” or retreat/go back a specific portion of a movement before proceeding to its original path. In essence, this is a tool to determine possible bounce points (support/buying levels) during a price pullback. The following are the corresponding meaning of the retracement levels:
- 0.382 is considered a “shallow retracement;.”
- 0.50 is considered a “half retracement” point and;
- 0.618 is a “deep retracement.”
Considering these, always put your stop-loss a few ticks below these retracement levels. In this illustration, if you entered at 0.382, your stop-loss must be a few ticks below the retracement level.
Bottomline
At the end of the day, it is important to realize that trading combines “science” and “art.” On the other end of the spectrum, highly methodological or automated-driven traders mainly utilize specific back-tested strategies to look for opportunities.
Yet, on the other side of the coin are highly creative and flexible traders who have a keen eye and prefer to be more discretion-based. Nevertheless, despite these two seemingly opposite types of traders, the secret to their consistency is not a foolproof trading system or strategy.
In fact, it is the opposite: they recognize that they won’t always get it right, so when mistaken, they never succumb to their ego and hold on ─ they always cut their losses short.
If you liked this post about Setting up a Stoploss, please consider subscribing to our YouTube Channel for more Investing content and follow us on Twitter.


